NHS · Waiting times · England · August 2026
How long do people wait for planned treatment?
Half of the 7.37 million pathways waiting in August 2026 had waited 12 weeks or less, but 35% had waited longer than the 18 weeks patients are promised, and 113,339 more than a year. Year-long waits are down by 74% from their peak, but were in the hundreds in 2013.
Evidence last reviewed 3 October 2026
Then and now Official statistics · UK Facts calculation of the change
July 2015 → July 2026 · England
Same hope. A longer wait.
Denise wants to get back to comfortable walks. Her story shows two separate referrals, eleven years apart. Over that period, the national median wait before planned inpatient or day-case treatment rose from 9.2 to 13.0 weeks.
Denise is fictional. These are national figures across specialties, not her medical record or a prediction of her wait.


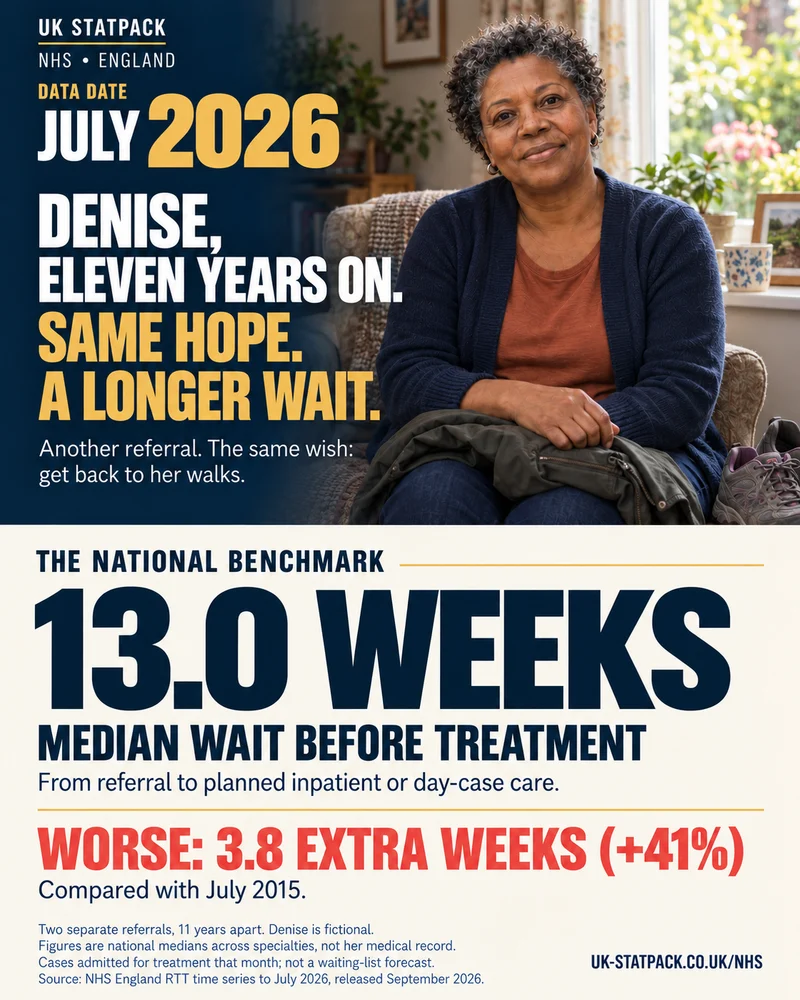
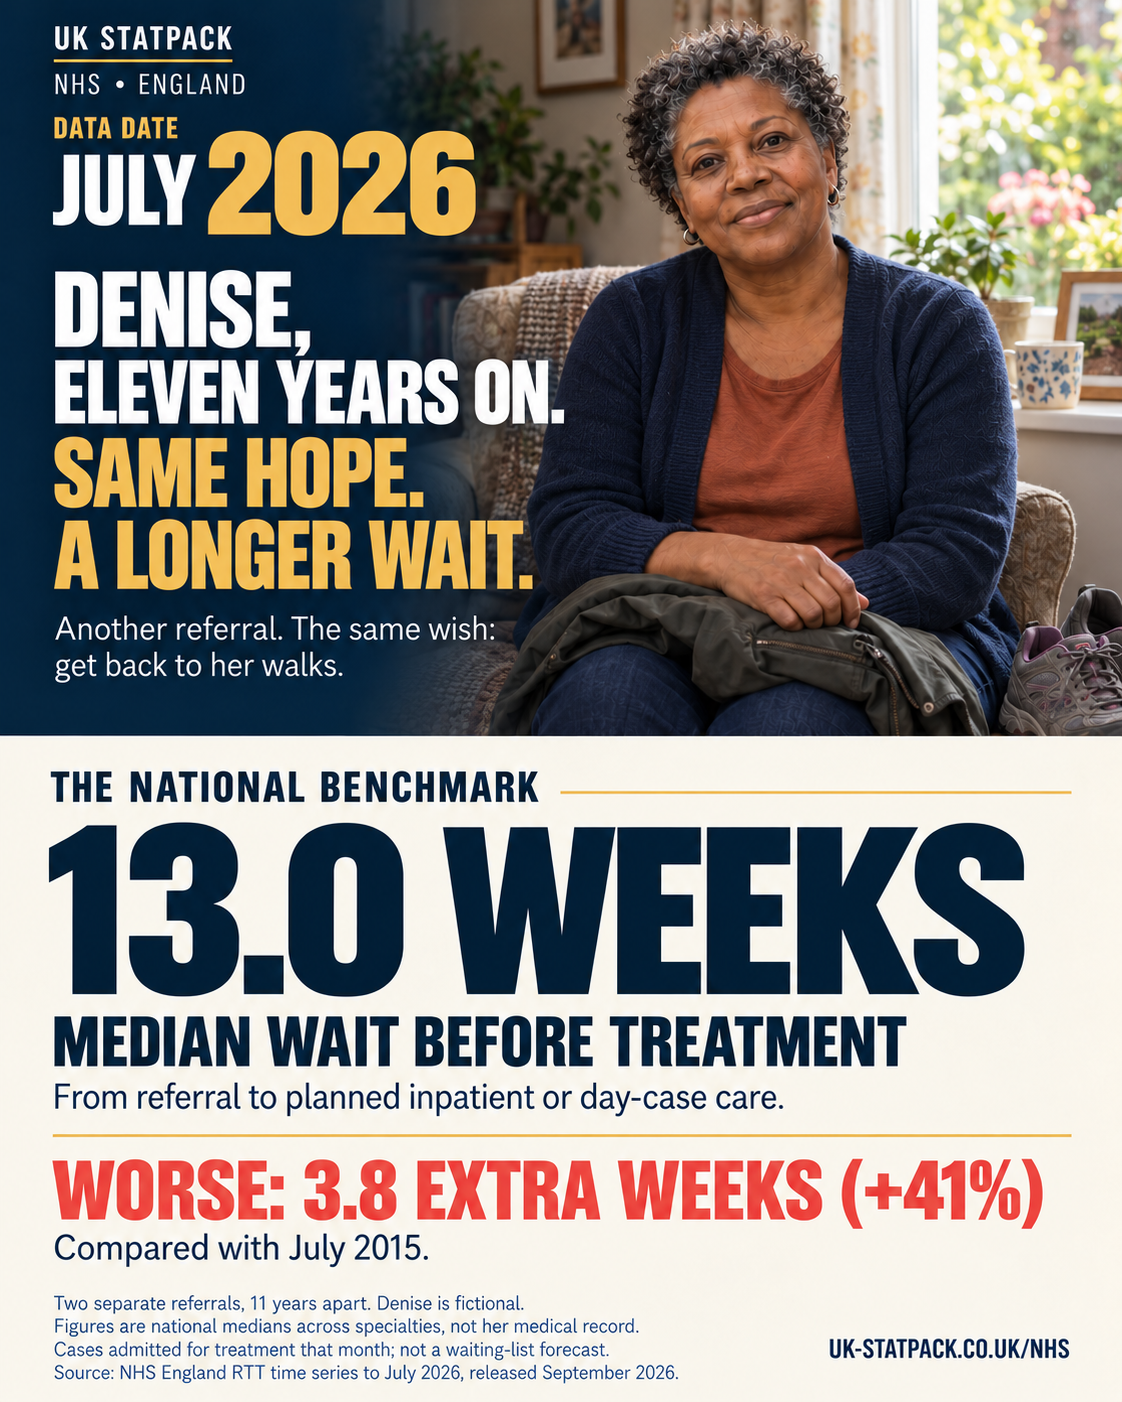
3.8 extra weeks before treatment (+41%)
National median for cases admitted for treatment in those months.
- July 2015: 9.2 weeks. July 2026: 13.0 weeks.
- Two separate referrals — not an eleven-year wait.
Why 13 weeks here and 12 elsewhere? This story measures the wait completed by cases admitted for treatment that month. The 12-week figure measures time already waited by cases still on the list. They describe different groups.
Sources and calculations: Denise, July 2015 vs July 2026
NHS England’s median wait from referral to the start of planned inpatient or day-case treatment, for cases admitted in July 2015 and July 2026, all specialties, England. A median is the middle value: half of these cases waited longer, half less.
| Measure | July 2015 | July 2026 | Change |
|---|---|---|---|
| Completed admitted (unadjusted) RTT pathways: median weeks from referral to treatment | 9.227129458794588 (shown as 9.2) | 13.0094696969697 (shown as 13.0) | +3.8 weeks (+41%) |
How it is calculated
- Difference = 13.0094697 − 9.2271295 = 3.782340238175113 weeks.
- Increase = (13.0094697 ÷ 9.2271295 − 1) × 100 = 40.99151588872614%.
- Shown as 9.2, 13.0, 3.8 and +41%.
Definitions, geography and dates
- Measure: completed admitted pathways, unadjusted — people whose referral-to-treatment (RTT) clock stopped because they were admitted for inpatient or day-case treatment in that month. The same unadjusted definition is used for both dates; the historic adjusted series that allowed clock pauses is not spliced in.
- Geography: England, all specialties. July 2026 figures were published by NHS England on 10 September 2026.
- This is not the 12.0-week median shown elsewhere on this page, which is the time already waited by incomplete pathways (cases still on the list) at the end of July 2026. The two measures describe different groups and are not one series.
What this does not show
- The data count pathways (cases), not necessarily unique people; one patient can have several pathways.
- It is not a forecast for a new referral, a knee- or condition-specific wait, an ethnicity-specific outcome, a guarantee of treatment or a prediction of recovery.
- Denise’s two referrals are separate illustrations, not one eleven-year wait.
- Provider reporting gaps, case mix and RTT reporting changes limit strict like-for-like interpretation. The July 2026 press notice lists missing providers, and national median estimates do not impute their waiting-time distributions. Community-service pathways were removed from RTT from February 2024.
- The long-term change is descriptive. It does not show that one policy caused it or that all NHS services have worsened.
Sources
- NHS England, RTT overview time series including estimates for missing trusts, July 2026 — Full Time Series, column Z, released 10 September 2026
- NHS England, Referral to treatment waiting times statistical press notice, July 2026 — released 10 September 2026
- NHS England, RTT statistics: user guidance and definitions
- NHS England, RTT data 2026-27
Cells used: NHS England RTT overview time series (July 2026): Full Time Series!Z112 (July 2015) and Z244 (July 2026), dates in C112 and C244; column Z is the completed-admitted unadjusted median wait.
Text of the two pictures
The people are fictional and the portraits are AI-generated. The pictures and these figures are a dated snapshot approved on 4 October 2026; they are updated together, never one without the other.
July 2015 picture
Large July 2015 data-date label. Younger Denise in a teal cardigan seated on the doorway bench holding walking shoes. Denise, a fictional Black British woman, holds walking shoes and hopes planned care will help her return to comfortable walks. England July 2015 national median referral-to-treatment wait for completed inpatient/day-case cases: 9.2 weeks. All-specialty benchmark, not her medical record.
Text in the picture
- UK Statpack. NHS • England. Data date July 2015.
- Meet Denise. She wants her walks back.
- Denise needs planned hospital care. She hopes treatment will get her walking comfortably again.
- The national benchmark: 9.2 weeks. Median wait before treatment. From referral to planned inpatient or day-case care.
- A shorter wait to get life moving again.
- Denise is fictional. Figures cover all specialties, not her medical record. Median for cases admitted for treatment that month; not a waiting-list forecast. Source: NHS England RTT time series to July 2026, released September 2026.
- UK-STATPACK.CO.UK/NHS
July 2026 picture
Large July 2026 data-date label. Recognisably older Denise with greyer curls, a navy cardigan and rust top, in a sitting room beside a garden window, walking jacket on her lap. An older Denise faces another referral eleven years later. The same wish: return to her walks. England July 2026 national median referral-to-treatment wait for completed inpatient/day-case cases: 13.0 weeks, about 3.8 weeks or 41% longer than July 2015. Two separate fictional referrals, not one eleven-year wait.
Text in the picture
- UK Statpack. NHS • England. Data date July 2026.
- Denise, eleven years on. Same hope. A longer wait.
- Another referral. The same wish: get back to her walks.
- The national benchmark: 13.0 weeks. Median wait before treatment. From referral to planned inpatient or day-case care.
- Worse: 3.8 extra weeks (+41%). Compared with July 2015.
- Two separate referrals, 11 years apart. Denise is fictional. Figures are national medians across specialties, not her medical record. Cases admitted for treatment that month; not a waiting-list forecast. Source: NHS England RTT time series to July 2026, released September 2026.
- UK-STATPACK.CO.UK/NHS
The length of the queue is not the length of the wait
A list of 7.37 million says how many treatments are waiting, not how long each person waits. In July 2026 the median wait was 12.0 weeks; one pathway in twelve had waited longer than 38.4 weeks (the 92nd percentile, which would be 18 weeks if the standard were met). These two figures are from an earlier month than the rest of this page and are being updated.
The list is a balance of flows. In the year to July 2026, new referrals (clock starts) per working day rose 3.0% and completed pathways rose 2.5% — operations and other admitted treatment fell 2.6% while outpatient completions rose 3.8%. With referrals growing almost as fast as treatment, the list shrinks only slowly. Some of the fall also comes from validation: removing people who no longer need treatment or have been treated elsewhere.
A pathway is one referral for one treatment. NHS England estimates about 85 people for every 100 pathways, so 7.37 million pathways means about 6.2 million people.
The longest waits
How many people wait more than a year?
Year-long waits have fallen from 436,127 to 113,339, far above the 2010s
Incomplete RTT pathways where the patient had waited more than 52 weeks, England, end of each month, thousands.
1996–2026 displayed window · observations only. Shading marks years outside the displayed record.
England · August 2007 to August 2026 · Official statistics
Sources, definitions and data — Year-long waits have fallen from 436,127 to 113,339, far above the 2010s
- Geography:
- England
- Measure:
- Thousands of pathways
- Period:
- August 2007 to August 2026
- Status:
- Official statistics
- Calculation:
- As published, including estimates for missing trusts; divided by 1,000.
- Compare with:
- The 2010s low: 295 in June 2013
- Not included / breaks:
- In 2007–08 the 18-week standard was still being introduced and reporting was less complete.
Source: NHS England, Referral to treatment (RTT) waiting times: overview time series including estimates for missing trusts. Chart NHS-04.
View the data as a table
| Month | Over 52 weeks |
|---|---|
| Aug 2007 | 578,682 |
| Aug 2008 | 140,727 |
| Aug 2009 | 33,016 |
| Aug 2010 | 20,889 |
| Aug 2011 | 19,938 |
| Aug 2012 | 2,352 |
| Aug 2013 | 350 |
| Aug 2014 | 688 |
| Aug 2015 | 855 |
| Aug 2016 | 1,219 |
| Aug 2017 | 1,935 |
| Aug 2018 | 3,569 |
| Aug 2019 | 1,468 |
| Aug 2020 | 111,093 |
| Mar 2021 | 436,127 |
| Aug 2021 | 295,362 |
| Aug 2022 | 390,852 |
| Aug 2023 | 395,170 |
| Aug 2024 | 282,664 |
| Aug 2025 | 190,499 |
| Aug 2026 | 113,339 |
Cancer
How quickly does cancer treatment start?
72% start cancer treatment within 62 days of an urgent referral, against an 85% standard
Share of patients starting first cancer treatment within 62 days of an urgent suspected-cancer referral, screening or consultant upgrade (combined 62-day standard), England, monthly.
1996–2026 displayed window · observations only. Shading marks years outside the displayed record.
England · April 2022 to August 2026 · Official statistics (latest months provisional)
Sources, definitions and data — 72% start cancer treatment within 62 days of an urgent referral, against an 85% standard
- Geography:
- England
- Measure:
- Per cent of patients treated
- Period:
- April 2022 to August 2026
- Status:
- Official statistics (latest months provisional)
- Calculation:
- As published. Combined measure introduced October 2023 and back-calculated to April 2022; the older urgent-GP-referral series is not joined to it.
- Compare with:
- 85% standard; NHS England target 80% for every trust by March 2027
Source: NHS England, Cancer waiting times: national time series. Chart NHS-13.
View the data as a table
| Month | Within 62 days (%) |
|---|---|
| Apr 2022 | 69.0 |
| May 2022 | 65.5 |
| Jun 2022 | 64.1 |
| Jul 2022 | 65.7 |
| Aug 2022 | 65.3 |
| Sep 2022 | 64.2 |
| Oct 2022 | 64.0 |
| Nov 2022 | 65.1 |
| Dec 2022 | 66.3 |
| Jan 2023 | 59.3 |
| Feb 2023 | 62.5 |
| Mar 2023 | 67.5 |
| Apr 2023 | 65.0 |
| May 2023 | 62.7 |
| Jun 2023 | 63.1 |
| Jul 2023 | 65.6 |
| Aug 2023 | 65.9 |
| Sep 2023 | 63.5 |
| Oct 2023 | 63.2 |
| Nov 2023 | 65.5 |
| Dec 2023 | 66.2 |
| Jan 2024 | 62.7 |
| Feb 2024 | 64.2 |
| Mar 2024 | 68.9 |
| Apr 2024 | 67.0 |
| May 2024 | 66.2 |
| Jun 2024 | 67.8 |
| Jul 2024 | 68.0 |
| Aug 2024 | 69.5 |
| Sep 2024 | 67.4 |
| Oct 2024 | 68.5 |
| Nov 2024 | 69.8 |
| Dec 2024 | 71.7 |
| Jan 2025 | 67.6 |
| Feb 2025 | 67.2 |
| Mar 2025 | 71.4 |
| Apr 2025 | 70.1 |
| May 2025 | 68.1 |
| Jun 2025 | 67.3 |
| Jul 2025 | 69.5 |
| Aug 2025 | 69.3 |
| Sep 2025 | 68.0 |
| Oct 2025 | 69.0 |
| Nov 2025 | 70.5 |
| Dec 2025 | 72.1 |
| Jan 2026 | 68.6 |
| Feb 2026 | 68.9 |
| Mar 2026 | 72.9 |
| Apr 2026 | 70.0 |
| May 2026 | 69.6 |
| Jun 2026 | 69.9 |
| Jul 2026 | 71.2 |
| Aug 2026 | 71.9 |
Twenty years of the 18-week standard
Share of pathways waiting under 18 weeks, England, monthly, against the 92% standard
Same source and definitions as NHS-02 on the NHS page. Scale 0–100%.
1996–2026 displayed window · observations only. Shading marks years outside the displayed record.
2007–2012: the target era. The 18-week referral-to-treatment standard was introduced with a deadline of the end of 2008, backed by extra funding and capacity. Waits fell fast: the share under 18 weeks rose from 57% when the series began to over 90%, and year-long waits almost disappeared.
2012–2020: slow slippage. With funding growing slowly and demand rising, the standard was last met in September 2015. The list grew from 2.4 million in March 2012 to 4.6 million by February 2020 — the pandemic hit a system that was already falling behind.
2020 onwards: the pandemic and recovery. Planned care largely stopped in spring 2020. The list rose to a peak of 7.77 million in September 2023 and has fallen since, while the 18-week share has risen to 65.2%. NHS England’s target is 70% by March 2027 and the 92% standard by March 2029.
What would change it is compared on the NHS page — see What would move the needle?
Sources and methods (3)
- NHS England, Referral to treatment (RTT) waiting times: overview time series including estimates for missing trusts — waiting list, 18-week and 52-week series
- NHS England, Referral to treatment waiting times statistical press notice, July 2026 (released 10 September 2026) — median and 92nd-percentile waits; clock starts and completed pathways; people per 100 pathways
- NHS England, Cancer waiting times: national time series — cancer 62-day and 28-day measures
Method notes
- Incomplete pathways at the end of each month, consultant-led care, England, including NHS England estimates for non-reporting trusts.
- Median and 92nd-percentile waits exclude estimates for missing trusts.
- Community-service pathways were removed from February 2024.