Economy · Pay · Great Britain · 2001–2025
What happened to pay?
Average weekly pay after inflation was 23.7% higher in 2025 than in 2000, but only 4.6% above its 2007 pre-crash level — a fall to 2014, a slow recovery, a second squeeze in 2022–23 and modest growth since. In the three months to July 2026, real pay was +0.9% on a year earlier.
Evidence last reviewed 3 October 2026
Then and now UK Facts calculation from official data
1996 → 2025 · Pay: Great Britain · Prices: UK
A bigger pay packet. A harder home to buy.
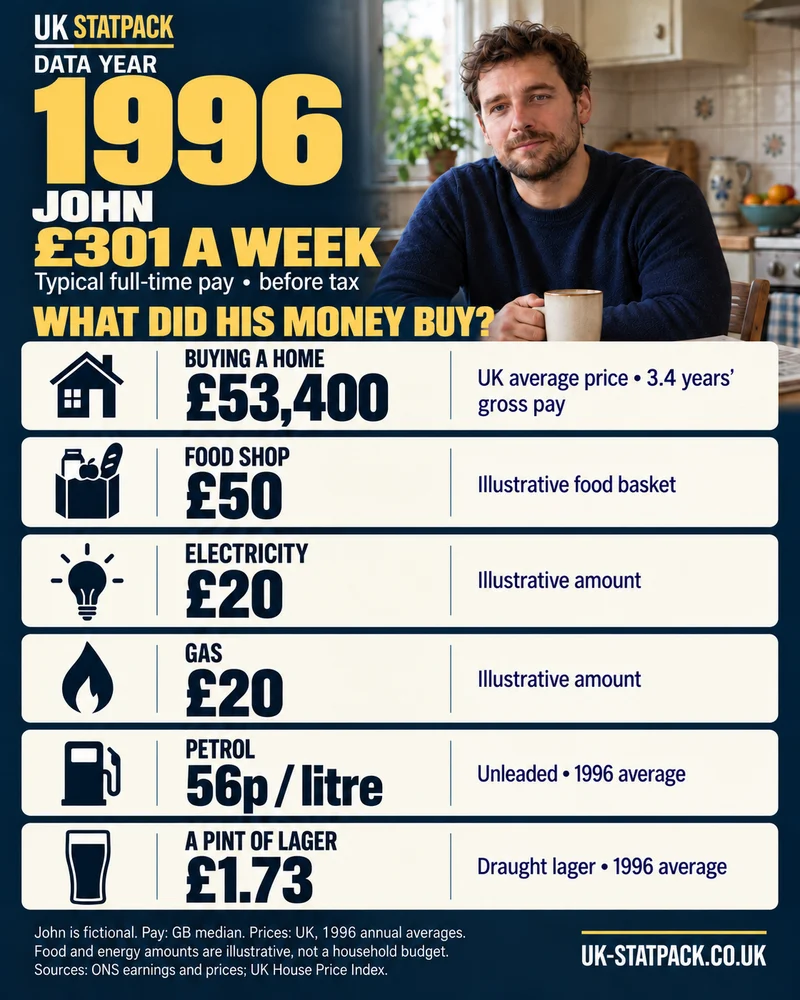
Using typical full-time pay, John’s wage rises from £301 to £767 a week. After average inflation, that buys roughly £160 more each week before tax. But buying a home, gas and electricity take a bigger share of pay.
John is fictional. The figures compare national benchmarks, not one person’s actual finances.
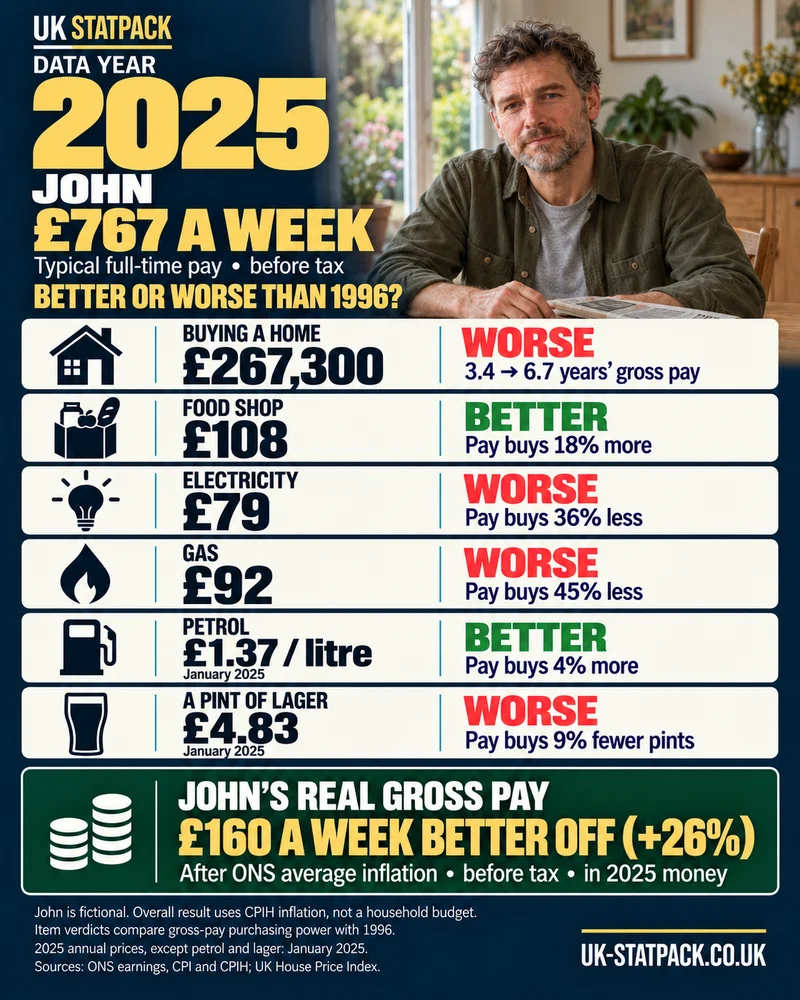
£160 a week more buying power (+26%)
Inflation-adjusted gross pay, before tax, in 2025 money. Not cash left after bills.
- Home purchase price: 3.4 years of annualised pay in 1996; 6.7 in 2025.
- Food and petrol: more purchasing power. Gas, electricity and lager: less.
This illustration uses median full-time pay from 1996; the charts below use average weekly earnings and different starting years.
Sources and calculations: John, 1996 vs 2025
Published median full-time gross weekly pay for Great Britain in 1996 and 2025, compared with UK prices in the same years. A median is the middle value: half of full-time employees earned more, half less.
| Measure | 1996 | 2025 | Shown as |
|---|---|---|---|
| Gross weekly pay, GB median, full-time (April) | £301.10 | £766.60 | £301 and £767 |
| CPIH all-items index, annual average (2015 = 100) | 68.5 | 138.0 | — |
| Weekly pay in 2025 money (CPIH) | £606.60 | £766.60 | £160 a week more (+26%) |
| UK average house purchase price (mean of 12 months) | £53,415.25 | £267,281.25 | £53,400 and £267,300 |
| House price ÷ (weekly pay × 52) | 3.4115 | 6.7050 | 3.4 and 6.7 years · worse |
| Item | 1996 | 2025 | Pay buys |
|---|---|---|---|
| Food shop (illustrative £50 basket) | £50 | £107.69 (shown as £108) | 18% more · better |
| Electricity (illustrative £20 amount) | £20 | £79.18 (shown as £79) | 36% less · worse |
| Gas (illustrative £20 amount) | £20 | £91.77 (shown as £92) | 45% less · worse |
| Unleaded petrol, per litre | 56p (1996 annual average) | £1.37 (January 2025) | 4% more · better |
| Draught lager, per pint | £1.73 (1996 annual average) | £4.83 (January 2025) | 9% fewer pints · worse |
Food, electricity and gas amounts are chosen illustrative amounts repriced with ONS CPI indices (food 65.7 → 141.5, electricity 48.7 → 192.8, gas 32.8 → 150.5; 2015 = 100). They are not measured weekly household budgets. Petrol and lager compare published average prices for 1996 with January 2025, the last observation in the series consulted.
How it is calculated
- 1996 pay in 2025 prices = £301.10 × 138.0 ÷ 68.5 = £606.5956204.
- Gain = £766.60 − £606.5956204 = £160.0043796 a week.
- Percentage = (£766.60 ÷ £606.5956204 − 1) × 100 = 26.3774373%.
- Rounded only for display: about £160 a week and +26%.
- Item verdicts: change in the quantity a week’s pay buys = ((2025 pay ÷ 1996 pay) ÷ (2025 price ÷ 1996 price) − 1) × 100, from unrounded values. This is not the change in the share of pay spent on the item.
Definitions, geography and dates
- Pay: ONS published GB median gross weekly earnings of adult full-time employees whose pay was not affected by absence, April of each year (New Earnings Survey 1996, Annual Survey of Hours and Earnings 2025). Not an age-specific median and not the same people followed over time.
- Prices: UK. Annual-average CPIH is used with each year’s April earnings benchmark, matching the annual price comparisons in the images.
- ONS survey coverage and methods changed between 1996 and 2025 (NES to ASHE, occupational classifications). This is an approximate comparison of published levels, not a fully method-adjusted continuous pay series.
- CPIH includes owner-occupiers’ housing consumption costs (what a home would cost to rent). It does not use house purchase prices or deposits, which is why the home price is shown separately.
- The house price is the UK House Price Index average acquisition price, a mean of the 12 monthly United Kingdom figures in each year; before full national coverage the official derived back series is used. Annual pay is weekly pay × 52 for this illustration, not ONS’s separately published annual earnings.
- This page’s charts use mean Average Weekly Earnings (ONS A3WX) from 2000 or 2007; John uses median full-time pay from 1996. The two are not combined, and the page’s +4.6% since 2007 is unchanged.
What this does not show
- The £160 is a gross-pay purchasing-power comparison using the whole CPIH basket. It is not net pay, disposable income, spare cash or saving, and it is not a total of the six item verdicts.
- No pension, tax, National Insurance, benefits, mortgage balance or actual household budget is modelled.
- Someone who bought a home in 1996 is not assumed to take out a new 2025 mortgage by ageing. No individual mortgage, tenure, wealth or savings history is known.
- Petrol and lager are published average prices; products and outlets change over time, so these are not identical-product indices. Petrol is unleaded and beer is draught lager, not all beer. The 4% petrol improvement is small and sensitive to the period chosen.
- John’s UK average house price and GB annualised weekly pay are a different benchmark from the housing story’s England median home and annual pay. The two stories must not be combined into one series.
Sources
- ONS, Earnings time series of median gross weekly earnings, 1968 to 2025 — GB Median Time-series, released 23 October 2025
- ONS, CPIH index, all items (2015 = 100) — L522, annual
- ONS, CPI index: food and non-alcoholic beverages — D7BU, annual
- ONS, CPI index: electricity — D7DT, annual
- ONS, CPI index: gas — D7DU, annual
- ONS, Average price: unleaded petrol per litre — CZMK (series ends January 2025)
- ONS, Average price: draught lager per pint — CZMS (last observation consulted: January 2025)
- ONS, Consumer price inflation, February 2025: discontinuation of the average-price petrol series
- HM Land Registry and ONS, UK House Price Index: data downloads, July 2026 — Average prices, United Kingdom
Cells used: ONS earnings workbook: GB Median Time-series!AB41 (1996) and AB80 (2025). CPIH L522, annual 1996 and 2025. UK HPI: 12 monthly United Kingdom average prices in each year, averaged here.
Text of the two pictures
The people are fictional and the portraits are AI-generated. The pictures and these figures are a dated snapshot approved on 4 October 2026; they are updated together, never one without the other.
1996 picture
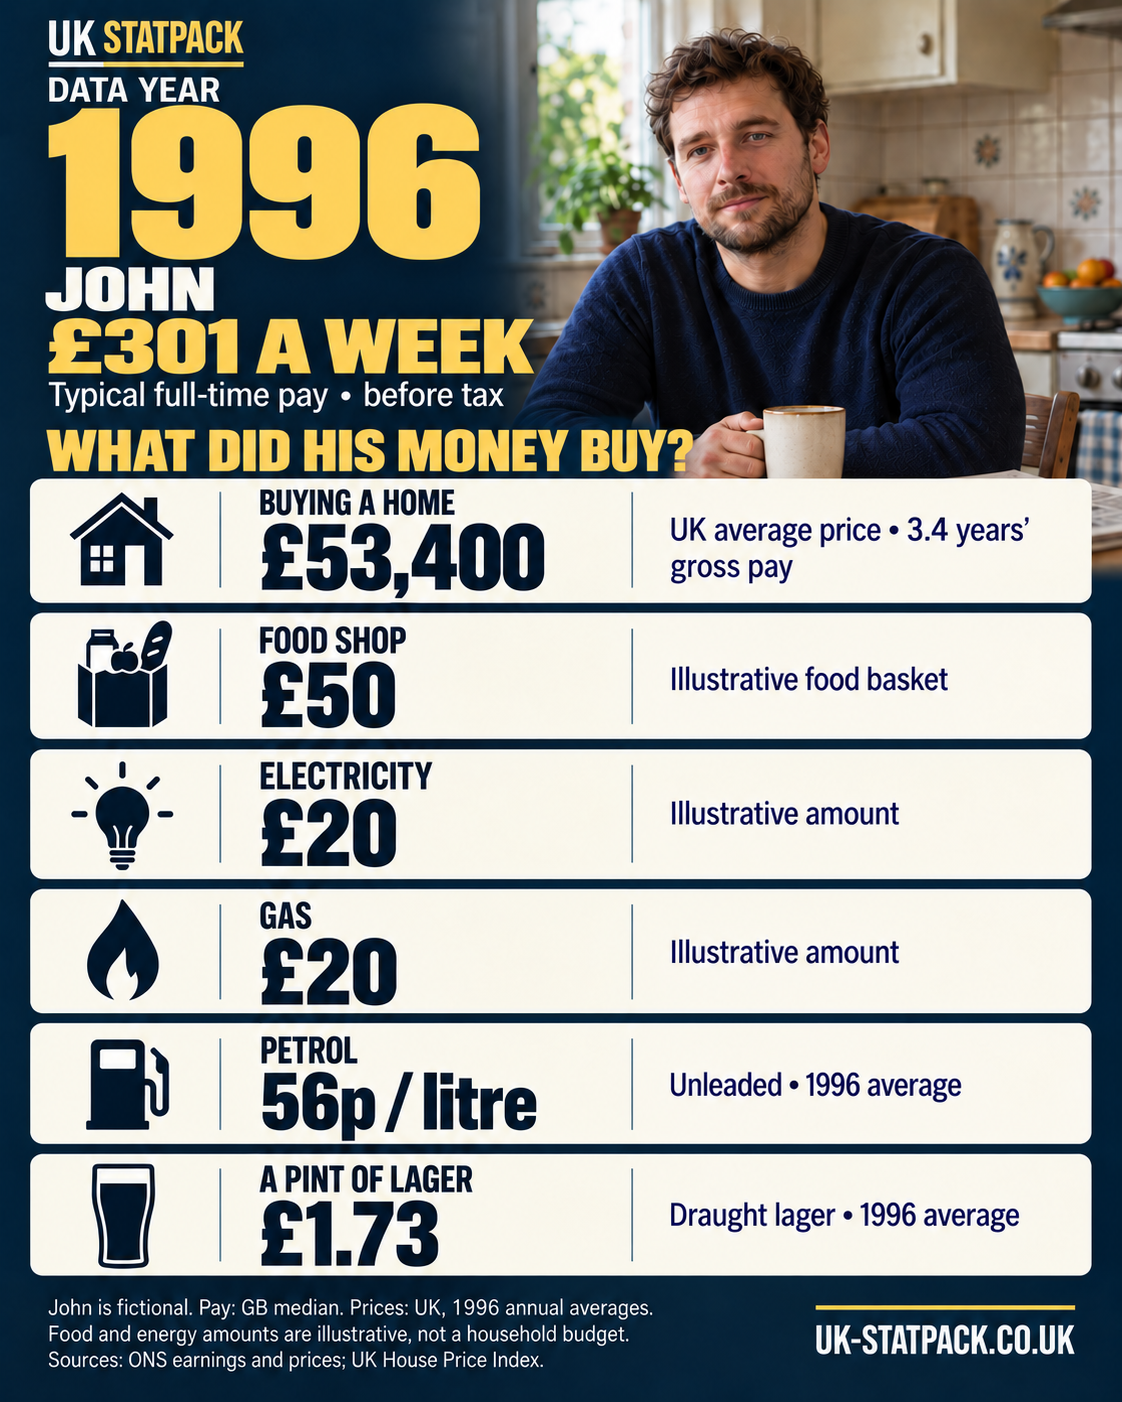
Large 1996 data-year label. Younger John in a 1990s tiled kitchen, navy jumper and mug. Fictional young John, 1996. Typical GB full-time gross weekly pay £301. UK average home £53,400, equivalent to 3.4 years of annualised pay. Illustrative food shop £50, electricity £20 and gas £20. Unleaded petrol 56p per litre and draught lager £1.73 per pint.
Text in the picture
- UK Statpack. Data year 1996.
- John. £301 a week. Typical full-time pay • before tax.
- What did his money buy?
- Buying a home: £53,400. UK average price • 3.4 years’ gross pay.
- Food shop: £50. Illustrative food basket.
- Electricity: £20. Illustrative amount.
- Gas: £20. Illustrative amount.
- Petrol: 56p / litre. Unleaded • 1996 average.
- A pint of lager: £1.73. Draught lager • 1996 average.
- John is fictional. Pay: GB median. Prices: UK, 1996 annual averages. Food and energy amounts are illustrative, not a household budget. Sources: ONS earnings and prices; UK House Price Index.
- UK-STATPACK.CO.UK
2025 picture
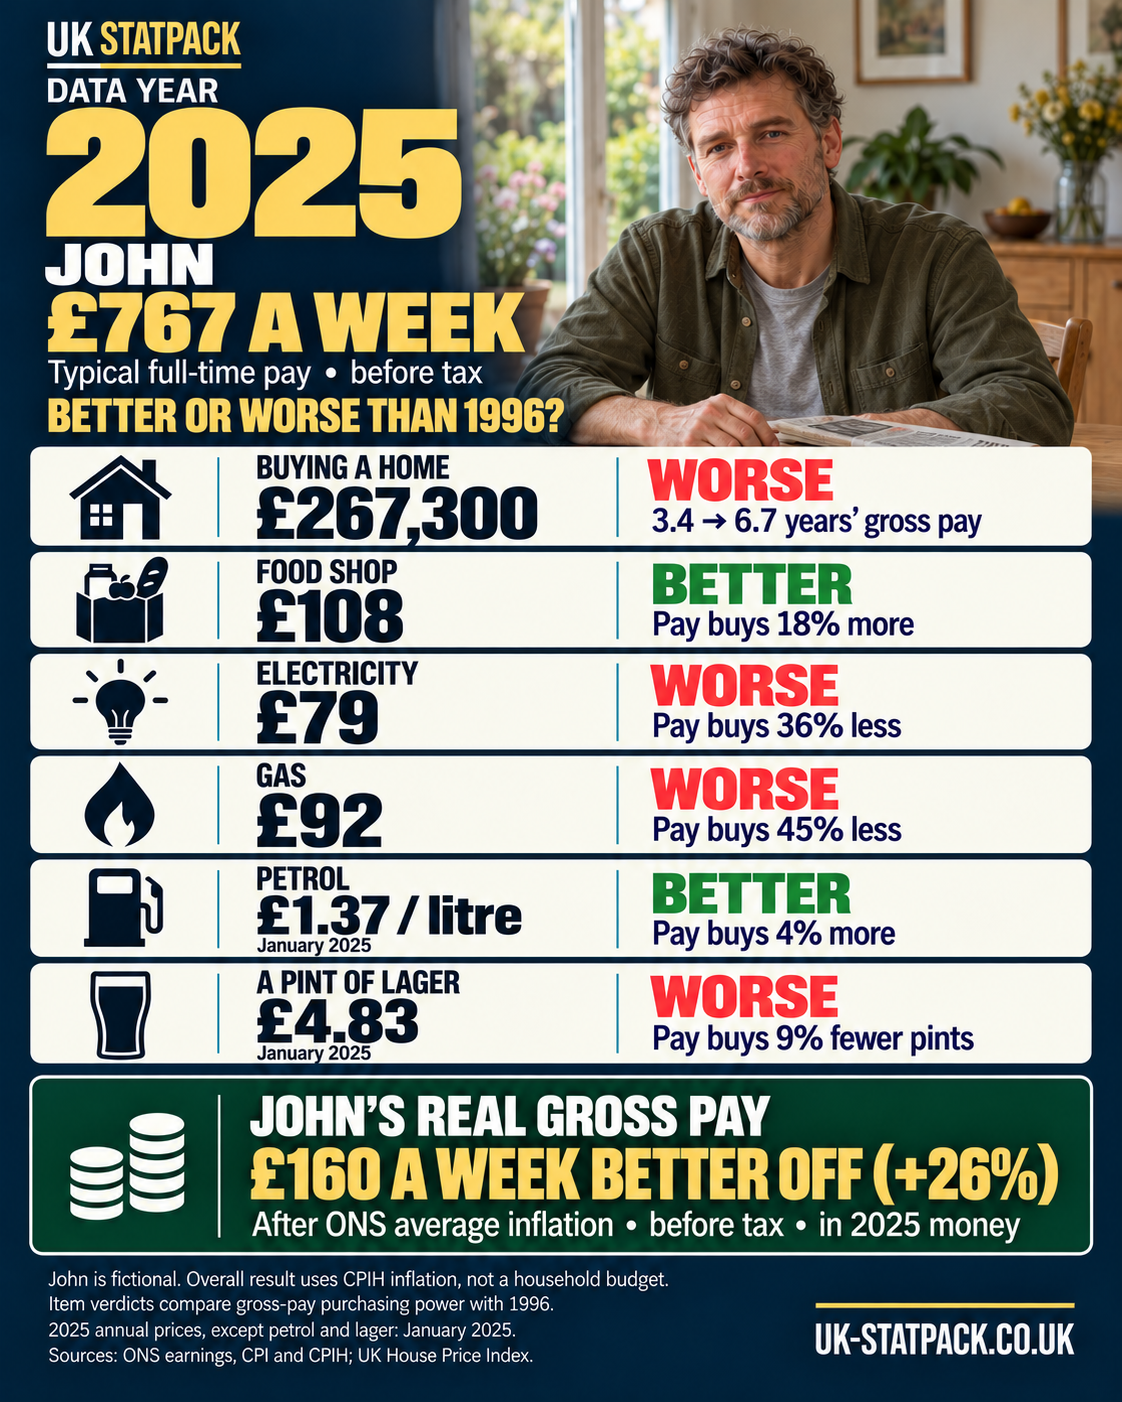
Large 2025 data-year label. Recognisably older John with greyer hair and beard, olive overshirt, seated beside a window in a different dining room. Older John in a 2025 comparison. Gross weekly pay £767. Item verdicts: home purchase worse, food better, electricity and gas worse, petrol better and lager worse. Overall real gross pay is about £160 a week higher, or 26%, after CPIH inflation, before tax and in 2025 pounds. This is a national benchmark, not spare cash after bills.
Text in the picture
- UK Statpack. Data year 2025.
- John. £767 a week. Typical full-time pay • before tax.
- Better or worse than 1996?
- Buying a home: £267,300. Worse: 3.4 → 6.7 years’ gross pay.
- Food shop: £108. Better: pay buys 18% more.
- Electricity: £79. Worse: pay buys 36% less.
- Gas: £92. Worse: pay buys 45% less.
- Petrol: £1.37 / litre (January 2025). Better: pay buys 4% more.
- A pint of lager: £4.83 (January 2025). Worse: pay buys 9% fewer pints.
- John’s real gross pay: £160 a week better off (+26%). After ONS average inflation • before tax • in 2025 money.
- John is fictional. Overall result uses CPIH inflation, not a household budget. Item verdicts compare gross-pay purchasing power with 1996. 2025 annual prices, except petrol and lager: January 2025. Sources: ONS earnings, CPI and CPIH; UK House Price Index.
- UK-STATPACK.CO.UK
1. Two squeezes since 2008
Average weekly pay including bonuses rose from £427 a week in 2000 to £505 in 2007 at 2015 prices — 18.3% in seven years. It did not fall at once: real pay held up in 2008, then slipped for six years to £473 in 2014, as wage rises lagged behind prices. It first passed the 2007 level in 2021, and the 2022–23 inflation shock then pushed it back. In 2025 it was £528, 4.6% above 2007 and 23.7% above 2000. What a week’s pay buys in essential bills.
When was pay falling behind prices?
Real pay fell year on year in 99 of the last 305 three-month periods
Change in average weekly earnings (total pay, whole economy) on a year earlier, adjusted for prices (CPIH) by ONS, three-month averages, Great Britain, Jan–Mar 2001 to May–Jul 2026.
1996–2026 displayed window · observations only. Shading marks years outside the displayed record.
Great Britain · Jan–Mar 2001 to May–Jul 2026 · Official statistics; the latest months are often revised
Sources, definitions and data — Real pay fell year on year in 99 of the last 305 three-month periods
- Geography:
- Great Britain — Employees
- Measure:
- Per cent change on the same three months a year earlier
- Period:
- Jan–Mar 2001 to May–Jul 2026
- Status:
- Official statistics; the latest months are often revised
- Calculation:
- As published (A3WW). Each point is a three-month average compared with the same three months a year earlier.
- Compare with:
- Zero: below the line, average pay bought less than a year before
- Not included / breaks:
- A mean across employees, so changes in who is employed move it: in 2020–21 job losses among lower-paid workers pushed the average up, then reversed. Excludes the self-employed and Northern Ireland.
Source: ONS, Average weekly earnings: real terms growth, total pay, three-month average, series A3WW (released 15 September 2026). Chart ECON-04.
View the data as a table
| Three months to | Real total pay growth (%) |
|---|---|
| Jan–Mar 2001 | 4.9 |
| Feb–Apr 2001 | 4.9 |
| Mar–May 2001 | 3.6 |
| Apr–Jun 2001 | 3.7 |
| May–Jul 2001 | 3.3 |
| Jun–Aug 2001 | 3.3 |
| Jul–Sep 2001 | 3.0 |
| Aug–Oct 2001 | 3.0 |
| Sep–Nov 2001 | 3.0 |
| Oct–Dec 2001 | 2.8 |
| Nov 2001–Jan 2002 | 2.2 |
| Dec 2001–Feb 2002 | 1.6 |
| Jan–Mar 2002 | 1.2 |
| Feb–Apr 2002 | 1.3 |
| Mar–May 2002 | 1.7 |
| Apr–Jun 2002 | 2.3 |
| May–Jul 2002 | 2.5 |
| Jun–Aug 2002 | 2.3 |
| Jul–Sep 2002 | 2.1 |
| Aug–Oct 2002 | 1.6 |
| Sep–Nov 2002 | 1.4 |
| Oct–Dec 2002 | 1.1 |
| Nov 2002–Jan 2003 | 0.9 |
| Dec 2002–Feb 2003 | 0.7 |
| Jan–Mar 2003 | 1.3 |
| Feb–Apr 2003 | 1.5 |
| Mar–May 2003 | 1.8 |
| Apr–Jun 2003 | 1.3 |
| May–Jul 2003 | 1.4 |
| Jun–Aug 2003 | 1.6 |
| Jul–Sep 2003 | 2.0 |
| Aug–Oct 2003 | 2.4 |
| Sep–Nov 2003 | 2.6 |
| Oct–Dec 2003 | 2.7 |
| Nov 2003–Jan 2004 | 3.8 |
| Dec 2003–Feb 2004 | 3.5 |
| Jan–Mar 2004 | 3.4 |
| Feb–Apr 2004 | 2.5 |
| Mar–May 2004 | 2.8 |
| Apr–Jun 2004 | 2.8 |
| May–Jul 2004 | 2.6 |
| Jun–Aug 2004 | 2.6 |
| Jul–Sep 2004 | 2.7 |
| Aug–Oct 2004 | 2.9 |
| Sep–Nov 2004 | 2.8 |
| Oct–Dec 2004 | 2.7 |
| Nov 2004–Jan 2005 | 2.5 |
| Dec 2004–Feb 2005 | 2.8 |
| Jan–Mar 2005 | 2.6 |
| Feb–Apr 2005 | 2.7 |
| Mar–May 2005 | 2.4 |
| Apr–Jun 2005 | 2.5 |
| May–Jul 2005 | 2.5 |
| Jun–Aug 2005 | 2.6 |
| Jul–Sep 2005 | 2.5 |
| Aug–Oct 2005 | 2.3 |
| Sep–Nov 2005 | 2.3 |
| Oct–Dec 2005 | 2.3 |
| Nov 2005–Jan 2006 | 1.9 |
| Dec 2005–Feb 2006 | 2.2 |
| Jan–Mar 2006 | 2.7 |
| Feb–Apr 2006 | 3.1 |
| Mar–May 2006 | 2.7 |
| Apr–Jun 2006 | 2.4 |
| May–Jul 2006 | 2.4 |
| Jun–Aug 2006 | 2.1 |
| Jul–Sep 2006 | 1.6 |
| Aug–Oct 2006 | 1.5 |
| Sep–Nov 2006 | 1.6 |
| Oct–Dec 2006 | 2.1 |
| Nov 2006–Jan 2007 | 2.5 |
| Dec 2006–Feb 2007 | 3.3 |
| Jan–Mar 2007 | 2.9 |
| Feb–Apr 2007 | 2.4 |
| Mar–May 2007 | 1.8 |
| Apr–Jun 2007 | 1.9 |
| May–Jul 2007 | 2.3 |
| Jun–Aug 2007 | 2.6 |
| Jul–Sep 2007 | 3.2 |
| Aug–Oct 2007 | 2.9 |
| Sep–Nov 2007 | 2.6 |
| Oct–Dec 2007 | 1.7 |
| Nov 2007–Jan 2008 | 1.4 |
| Dec 2007–Feb 2008 | 1.0 |
| Jan–Mar 2008 | 1.6 |
| Feb–Apr 2008 | 1.8 |
| Mar–May 2008 | 1.7 |
| Apr–Jun 2008 | 0.8 |
| May–Jul 2008 | -0.1 |
| Jun–Aug 2008 | -0.8 |
| Jul–Sep 2008 | -1.4 |
| Aug–Oct 2008 | -1.4 |
| Sep–Nov 2008 | -1.5 |
| Oct–Dec 2008 | -1.0 |
| Nov 2008–Jan 2009 | -2.1 |
| Dec 2008–Feb 2009 | -4.5 |
| Jan–Mar 2009 | -5.5 |
| Feb–Apr 2009 | -4.3 |
| Mar–May 2009 | -1.9 |
| Apr–Jun 2009 | -0.9 |
| May–Jul 2009 | -1.1 |
| Jun–Aug 2009 | -0.9 |
| Jul–Sep 2009 | -0.7 |
| Aug–Oct 2009 | -0.6 |
| Sep–Nov 2009 | -0.5 |
| Oct–Dec 2009 | -0.8 |
| Nov 2009–Jan 2010 | -0.5 |
| Dec 2009–Feb 2010 | 1.8 |
| Jan–Mar 2010 | 2.0 |
| Feb–Apr 2010 | 1.4 |
| Mar–May 2010 | -1.0 |
| Apr–Jun 2010 | -1.2 |
| May–Jul 2010 | -0.9 |
| Jun–Aug 2010 | -0.8 |
| Jul–Sep 2010 | -0.6 |
| Aug–Oct 2010 | -0.6 |
| Sep–Nov 2010 | -0.7 |
| Oct–Dec 2010 | -0.9 |
| Nov 2010–Jan 2011 | -0.3 |
| Dec 2010–Feb 2011 | -0.6 |
| Jan–Mar 2011 | -0.6 |
| Feb–Apr 2011 | -1.5 |
| Mar–May 2011 | -1.3 |
| Apr–Jun 2011 | -1.3 |
| May–Jul 2011 | -1.1 |
| Jun–Aug 2011 | -1.3 |
| Jul–Sep 2011 | -1.9 |
| Aug–Oct 2011 | -2.2 |
| Sep–Nov 2011 | -2.2 |
| Oct–Dec 2011 | -2.0 |
| Nov 2011–Jan 2012 | -2.2 |
| Dec 2011–Feb 2012 | -2.2 |
| Jan–Mar 2012 | -2.3 |
| Feb–Apr 2012 | -1.7 |
| Mar–May 2012 | -1.3 |
| Apr–Jun 2012 | -1.0 |
| May–Jul 2012 | -1.0 |
| Jun–Aug 2012 | -0.7 |
| Jul–Sep 2012 | -0.5 |
| Aug–Oct 2012 | -0.5 |
| Sep–Nov 2012 | -0.7 |
| Oct–Dec 2012 | -1.1 |
| Nov 2012–Jan 2013 | -1.1 |
| Dec 2012–Feb 2013 | -1.3 |
| Jan–Mar 2013 | -1.9 |
| Feb–Apr 2013 | -1.0 |
| Mar–May 2013 | -0.8 |
| Apr–Jun 2013 | -0.3 |
| May–Jul 2013 | -1.3 |
| Jun–Aug 2013 | -1.6 |
| Jul–Sep 2013 | -1.6 |
| Aug–Oct 2013 | -1.4 |
| Sep–Nov 2013 | -1.2 |
| Oct–Dec 2013 | -0.9 |
| Nov 2013–Jan 2014 | -0.6 |
| Dec 2013–Feb 2014 | -0.1 |
| Jan–Mar 2014 | 0.1 |
| Feb–Apr 2014 | -1.0 |
| Mar–May 2014 | -1.5 |
| Apr–Jun 2014 | -1.9 |
| May–Jul 2014 | -1.2 |
| Jun–Aug 2014 | -1.0 |
| Jul–Sep 2014 | -0.6 |
| Aug–Oct 2014 | 0.0 |
| Sep–Nov 2014 | 0.5 |
| Oct–Dec 2014 | 0.9 |
| Nov 2014–Jan 2015 | 1.1 |
| Dec 2014–Feb 2015 | 1.1 |
| Jan–Mar 2015 | 1.9 |
| Feb–Apr 2015 | 2.3 |
| Mar–May 2015 | 2.7 |
| Apr–Jun 2015 | 2.1 |
| May–Jul 2015 | 2.4 |
| Jun–Aug 2015 | 2.7 |
| Jul–Sep 2015 | 2.6 |
| Aug–Oct 2015 | 2.1 |
| Sep–Nov 2015 | 1.7 |
| Oct–Dec 2015 | 1.5 |
| Nov 2015–Jan 2016 | 1.6 |
| Dec 2015–Feb 2016 | 1.4 |
| Jan–Mar 2016 | 1.4 |
| Feb–Apr 2016 | 1.4 |
| Mar–May 2016 | 1.7 |
| Apr–Jun 2016 | 1.9 |
| May–Jul 2016 | 1.7 |
| Jun–Aug 2016 | 1.6 |
| Jul–Sep 2016 | 1.4 |
| Aug–Oct 2016 | 1.3 |
| Sep–Nov 2016 | 1.3 |
| Oct–Dec 2016 | 0.9 |
| Nov 2016–Jan 2017 | 0.4 |
| Dec 2016–Feb 2017 | 0.1 |
| Jan–Mar 2017 | 0.1 |
| Feb–Apr 2017 | -0.2 |
| Mar–May 2017 | -0.5 |
| Apr–Jun 2017 | -0.4 |
| May–Jul 2017 | -0.3 |
| Jun–Aug 2017 | -0.3 |
| Jul–Sep 2017 | -0.4 |
| Aug–Oct 2017 | -0.2 |
| Sep–Nov 2017 | -0.3 |
| Oct–Dec 2017 | -0.2 |
| Nov 2017–Jan 2018 | -0.2 |
| Dec 2017–Feb 2018 | 0.0 |
| Jan–Mar 2018 | 0.1 |
| Feb–Apr 2018 | 0.3 |
| Mar–May 2018 | 0.4 |
| Apr–Jun 2018 | 0.3 |
| May–Jul 2018 | 0.4 |
| Jun–Aug 2018 | 0.6 |
| Jul–Sep 2018 | 0.8 |
| Aug–Oct 2018 | 1.1 |
| Sep–Nov 2018 | 1.2 |
| Oct–Dec 2018 | 1.3 |
| Nov 2018–Jan 2019 | 1.2 |
| Dec 2018–Feb 2019 | 1.3 |
| Jan–Mar 2019 | 1.3 |
| Feb–Apr 2019 | 1.4 |
| Mar–May 2019 | 1.7 |
| Apr–Jun 2019 | 2.1 |
| May–Jul 2019 | 2.1 |
| Jun–Aug 2019 | 1.9 |
| Jul–Sep 2019 | 2.0 |
| Aug–Oct 2019 | 1.6 |
| Sep–Nov 2019 | 1.6 |
| Oct–Dec 2019 | 1.2 |
| Nov 2019–Jan 2020 | 1.3 |
| Dec 2019–Feb 2020 | 0.9 |
| Jan–Mar 2020 | 0.5 |
| Feb–Apr 2020 | -0.4 |
| Mar–May 2020 | -1.2 |
| Apr–Jun 2020 | -1.8 |
| May–Jul 2020 | -1.7 |
| Jun–Aug 2020 | -0.6 |
| Jul–Sep 2020 | 0.7 |
| Aug–Oct 2020 | 2.1 |
| Sep–Nov 2020 | 3.0 |
| Oct–Dec 2020 | 3.8 |
| Nov 2020–Jan 2021 | 3.9 |
| Dec 2020–Feb 2021 | 3.6 |
| Jan–Mar 2021 | 3.2 |
| Feb–Apr 2021 | 4.5 |
| Mar–May 2021 | 5.8 |
| Apr–Jun 2021 | 6.8 |
| May–Jul 2021 | 6.2 |
| Jun–Aug 2021 | 4.7 |
| Jul–Sep 2021 | 3.1 |
| Aug–Oct 2021 | 1.7 |
| Sep–Nov 2021 | 0.6 |
| Oct–Dec 2021 | 0.5 |
| Nov 2021–Jan 2022 | 0.4 |
| Dec 2021–Feb 2022 | 1.0 |
| Jan–Mar 2022 | 1.7 |
| Feb–Apr 2022 | 0.6 |
| Mar–May 2022 | -0.8 |
| Apr–Jun 2022 | -2.5 |
| May–Jul 2022 | -2.5 |
| Jun–Aug 2022 | -2.3 |
| Jul–Sep 2022 | -2.6 |
| Aug–Oct 2022 | -2.6 |
| Sep–Nov 2022 | -2.5 |
| Oct–Dec 2022 | -2.9 |
| Nov 2022–Jan 2023 | -2.7 |
| Dec 2022–Feb 2023 | -2.7 |
| Jan–Mar 2023 | -2.5 |
| Feb–Apr 2023 | -1.8 |
| Mar–May 2023 | -1.1 |
| Apr–Jun 2023 | 0.5 |
| May–Jul 2023 | 1.2 |
| Jun–Aug 2023 | 1.4 |
| Jul–Sep 2023 | 1.4 |
| Aug–Oct 2023 | 1.3 |
| Sep–Nov 2023 | 1.5 |
| Oct–Dec 2023 | 1.5 |
| Nov 2023–Jan 2024 | 1.6 |
| Dec 2023–Feb 2024 | 1.8 |
| Jan–Mar 2024 | 1.8 |
| Feb–Apr 2024 | 2.1 |
| Mar–May 2024 | 2.3 |
| Apr–Jun 2024 | 1.8 |
| May–Jul 2024 | 1.4 |
| Jun–Aug 2024 | 1.1 |
| Jul–Sep 2024 | 1.7 |
| Aug–Oct 2024 | 2.3 |
| Sep–Nov 2024 | 2.3 |
| Oct–Dec 2024 | 2.5 |
| Nov 2024–Jan 2025 | 2.0 |
| Dec 2024–Feb 2025 | 2.1 |
| Jan–Mar 2025 | 1.8 |
| Feb–Apr 2025 | 1.4 |
| Mar–May 2025 | 0.8 |
| Apr–Jun 2025 | 0.4 |
| May–Jul 2025 | 0.6 |
| Jun–Aug 2025 | 0.9 |
| Jul–Sep 2025 | 0.8 |
| Aug–Oct 2025 | 0.8 |
| Sep–Nov 2025 | 0.7 |
| Oct–Dec 2025 | 0.5 |
| Nov 2025–Jan 2026 | 0.8 |
| Dec 2025–Feb 2026 | 0.6 |
| Jan–Mar 2026 | 1.1 |
| Feb–Apr 2026 | 1.2 |
| Mar–May 2026 | 1.2 |
| Apr–Jun 2026 | 1.2 |
| May–Jul 2026 | 0.9 |
2. What an average hides
It is a mean, not the typical worker. Average weekly earnings divide total pay by the number of employees, so a relatively small number of high earners pull it up. ONS’s Annual Survey of Hours and Earnings publishes medians, which sit below the mean.
Who is employed changes the average. In 2020 many lower-paid jobs disappeared during the pandemic, which lifted average pay without anyone’s pay rising; the effect reversed as those jobs returned. Part of the jump past the 2007 level in 2021 was this composition effect.
Pay is not household income. Real pay adjusts for prices but does not net off tax, rent, mortgage payments or childcare, and ignores benefits and other earners in the household. Two people on the same pay can have very different amounts left. What households have left.
Which price index. ONS adjusts these figures with CPIH, its lead inflation measure, which includes owner-occupiers’ housing costs. ONS also publishes regular pay excluding bonuses (series A2FC), which gives different levels; this site uses total pay including bonuses (A3WX) throughout. Both show the same pattern: a long fall, then a slow, modest recovery.
Locally, official pay figures are annual, cash-terms and residence-based medians, so they cannot be set against this national weekly real-terms mean. Compare areas on their own terms on the local jobs page.
3. Productivity: the long-run ceiling
Over decades, pay can only rise as fast as the value of what each hour of work produces. Output per hour grew 2.2% a year from 1990 to 2007 and 0.4% a year since. It is shown on its own chart: productivity is deflated by output prices and real pay by consumer prices, so putting them on one axis would imply a comparison the data do not support.
Is each hour of work producing more?
Output per hour grew 2.2% a year before 2007 and 0.4% a year since
Output per hour worked, UK whole economy, annual average of the quarterly index, rebased to 2007 = 100, 1990 to 2025.
1996–2026 displayed window · observations only. Shading marks years outside the displayed record.
United Kingdom · 1990 to 2025 · Official statistics; revised with the national accounts
Sources, definitions and data — Output per hour grew 2.2% a year before 2007 and 0.4% a year since
- Geography:
- United Kingdom — Whole economy
- Measure:
- Index, 2007 = 100
- Period:
- 1990 to 2025
- Status:
- Official statistics; revised with the national accounts
- Calculation:
- Site calculation: the four quarterly LZVB values averaged for each complete year, divided by the 2007 average.
- Compare with:
- 2007 = 100
- Not included / breaks:
- A whole-economy average; shifts between industries move it. It measures output per hour, not pay, and is deflated by output prices, not consumer prices — so it cannot be put on the same axis as real pay.
Source: ONS, Output per hour worked, UK whole economy, series LZVB. Chart ECON-05.
View the data as a table
| Year | Index (2007 = 100) |
|---|---|
| 1990 | 68.6 |
| 1991 | 70.7 |
| 1992 | 73.0 |
| 1993 | 75.6 |
| 1994 | 76.9 |
| 1995 | 77.6 |
| 1996 | 79.1 |
| 1997 | 81.0 |
| 1998 | 83.0 |
| 1999 | 84.8 |
| 2000 | 88.5 |
| 2001 | 89.7 |
| 2002 | 91.3 |
| 2003 | 93.7 |
| 2004 | 94.8 |
| 2005 | 96.4 |
| 2006 | 98.1 |
| 2007 | 100.0 |
| 2008 | 99.7 |
| 2009 | 98.0 |
| 2010 | 99.8 |
| 2011 | 100.3 |
| 2012 | 100.0 |
| 2013 | 99.7 |
| 2014 | 100.1 |
| 2015 | 100.5 |
| 2016 | 101.5 |
| 2017 | 103.5 |
| 2018 | 104.2 |
| 2019 | 104.1 |
| 2020 | 105.6 |
| 2021 | 107.1 |
| 2022 | 108.0 |
| 2023 | 107.6 |
| 2024 | 106.8 |
| 2025 | 106.8 |
Competing explanations
Weak productivity. The mainstream view is that pay stalled mainly because output per hour stalled. Why productivity slowed is disputed: the financial crisis and its damage to lending, low business investment, uncertainty after the 2016 referendum, slower spread of new technology and a shift towards lower-productivity work are all candidates, and economists do not agree on the weights.
Price shocks. Both squeezes coincided with inflation driven by import prices — the fall in sterling in 2008 and higher commodity prices in 2010–11, and energy and food in 2022. Import price shocks make the country poorer as a whole, and pay caught up only with a lag.
The share going to pay. Some argue that weaker bargaining power has held pay below productivity. Comparisons are sensitive to which price index and which pay measure are used (pensions and national insurance contributions count as pay costs but not as take-home pay), so this is genuinely contested.
None of these is settled by the charts above. What they do show is that a return to pre-2008 pay growth would need a return to something like pre-2008 productivity growth.
What would change it
Investment incentives, planning reform, skills and cheaper energy — the long-run levers on output per hour — are compared with their owners, costs and evidence in What would move the needle?. For hours, contracts and the jobs market see pay and security.
Sources and methods (4)
- ONS, Average weekly earnings: real terms, whole economy, total pay, series A3WX (annual averages) (released 15 September 2026) — real average weekly earnings (levels)
- ONS, Average weekly earnings: real terms growth, total pay, three-month average, series A3WW (released 15 September 2026) — real pay growth
- ONS, Output per hour worked, UK whole economy, series LZVB — output per hour worked
- ONS, Average weekly earnings in Great Britain: September 2026 (released 15 September 2026) — CPIH deflation of real pay; latest commentary
Method notes
- Real pay: ONS Average Weekly Earnings, whole economy, total pay including bonuses, seasonally adjusted, deflated by ONS with CPIH. Great Britain; employees only.
- Growth figures compare a three-month average with the same three months a year earlier, as ONS publishes them.
- Output per hour: ONS whole-economy index, averaged over the four quarters of each complete year.