Housing · Buying · England · 2025
Buying: what stands between renters and a first home?
Three separate hurdles: the price relative to pay (7.6 times median earnings), the deposit, and the monthly cost of a mortgage. The first has eased since 2021; the third has not — quoted rates for a two-year fix at 90% loan to value were 5.37% in September 2026, against 1.95% at the end of 2021.
Evidence last reviewed 3 October 2026
1. The price, relative to pay
The house price to earnings ratio is the standard measure: the typical home in England cost 7.6 times the typical full-time worker’s annual pay in 2025, down from 9.1 in 2021. For cheaper homes against lower pay the multiple is 7.0. Both are about twice the 1997 level.
Is buying a cheaper home any easier?
Cheaper homes cost 7.0 times lower earnings — about twice the 1997 multiple
Median house price ÷ median full-time earnings, and lower-quartile price ÷ lower-quartile full-time earnings, England, 1997 to the latest year.
1996–2026 displayed window · observations only. Shading marks years outside the displayed record.
England · 1997 to 2025 · Official statistics
Sources, definitions and data — Cheaper homes cost 7.0 times lower earnings — about twice the 1997 multiple
- Geography:
- England — Residential sales; full-time employees, workplace-based
- Measure:
- Multiple of annual earnings
- Period:
- 1997 to 2025
- Status:
- Official statistics
- Calculation:
- As published by ONS.
- Compare with:
- 1997, the start of the series
- Not included / breaks:
- Lower-quartile homes are compared with lower-quartile pay, not with median pay, so the two lines answer different questions.
Source: ONS, Housing affordability in England and Wales: 2025, dataset Tables 1c and 2c (released 26 March 2026). Chart HOUSE-05.
View the data as a table
| Year | Median ratio | Lower-quartile ratio |
|---|---|---|
| 1997 | 3.54 | 3.57 |
| 1998 | 3.67 | 3.57 |
| 1999 | 3.96 | 3.77 |
| 2000 | 4.19 | 3.85 |
| 2001 | 4.50 | 4.08 |
| 2002 | 5.12 | 4.51 |
| 2003 | 5.93 | 5.21 |
| 2004 | 6.60 | 6.27 |
| 2005 | 6.79 | 6.82 |
| 2006 | 6.95 | 7.17 |
| 2007 | 7.15 | 7.21 |
| 2008 | 6.97 | 6.91 |
| 2009 | 6.40 | 6.48 |
| 2010 | 6.85 | 6.86 |
| 2011 | 6.80 | 6.72 |
| 2012 | 6.77 | 6.58 |
| 2013 | 6.76 | 6.57 |
| 2014 | 7.09 | 6.91 |
| 2015 | 7.54 | 7.11 |
| 2016 | 7.72 | 7.16 |
| 2017 | 7.91 | 7.26 |
| 2018 | 8.04 | 7.34 |
| 2019 | 7.88 | 7.26 |
| 2020 | 7.86 | 7.18 |
| 2021 | 9.06 | 8.26 |
| 2022 | 8.56 | 7.62 |
| 2023 | 8.45 | 7.48 |
| 2024 | 7.84 | 7.02 |
| 2025 | 7.63 | 6.98 |
2. The deposit
Because the ratio is a multiple of a year’s pay, the deposit follows directly from it. A 10% deposit on a typical home is 76% of a year’s gross median full-time pay — before tax, and before rent and living costs are paid out of the same income. A 5% deposit is half that, but means a higher interest rate (below).
This is why the deposit, not the monthly payment, is often the binding constraint for renters: many pay as much in rent as a mortgage would cost but cannot save the lump sum while doing so. Help from family closes the gap for some buyers and not others, which is one way housing wealth passes between generations. We do not have a reliable official series on how many first-time buyers receive family help, so we do not quote one.
UK Facts calculation: 10% × 7.6 = 0.8 years of median full-time pay.
Then and now Illustrative model · UK Facts calculation from ONS data
1997 → 2025 · England · Illustrative savings model
Same dream. More than twice the wait.
Priya and Daniel are saving for a first home for baby Leah. In 2025, Leah has grown up and is saving with Samir. With two typical full-time salaries and the same saving rule, the time to a 10% deposit rises from 21 to 46 months.
A fictional family and an illustrative calculation using ONS data.
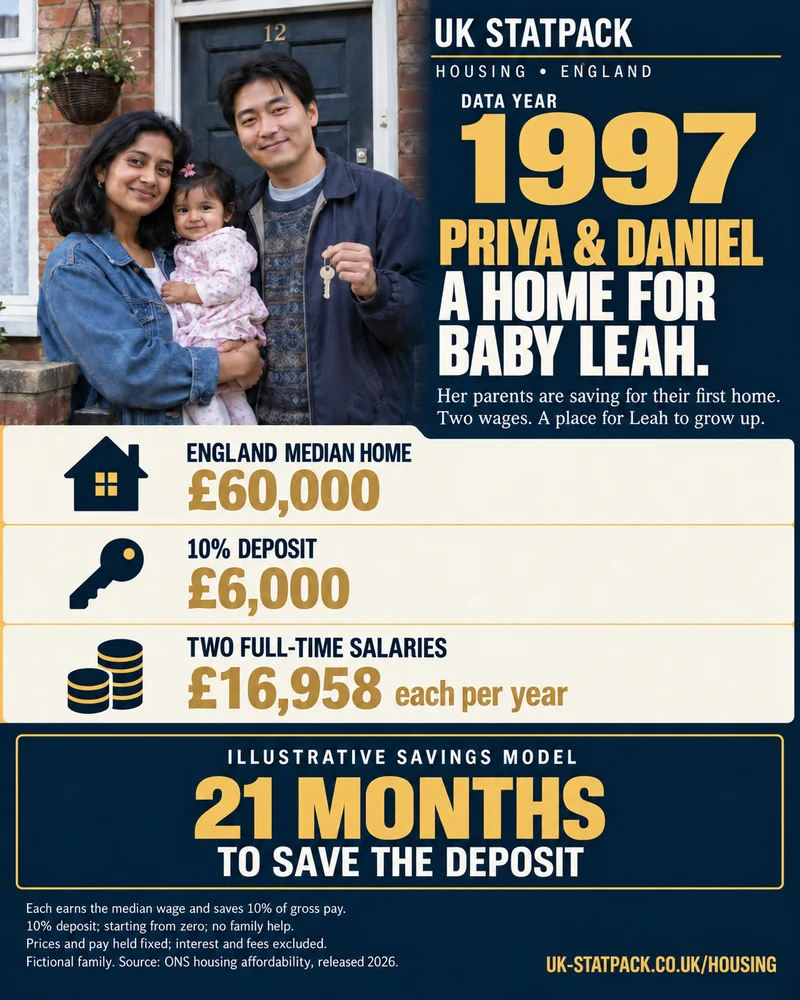

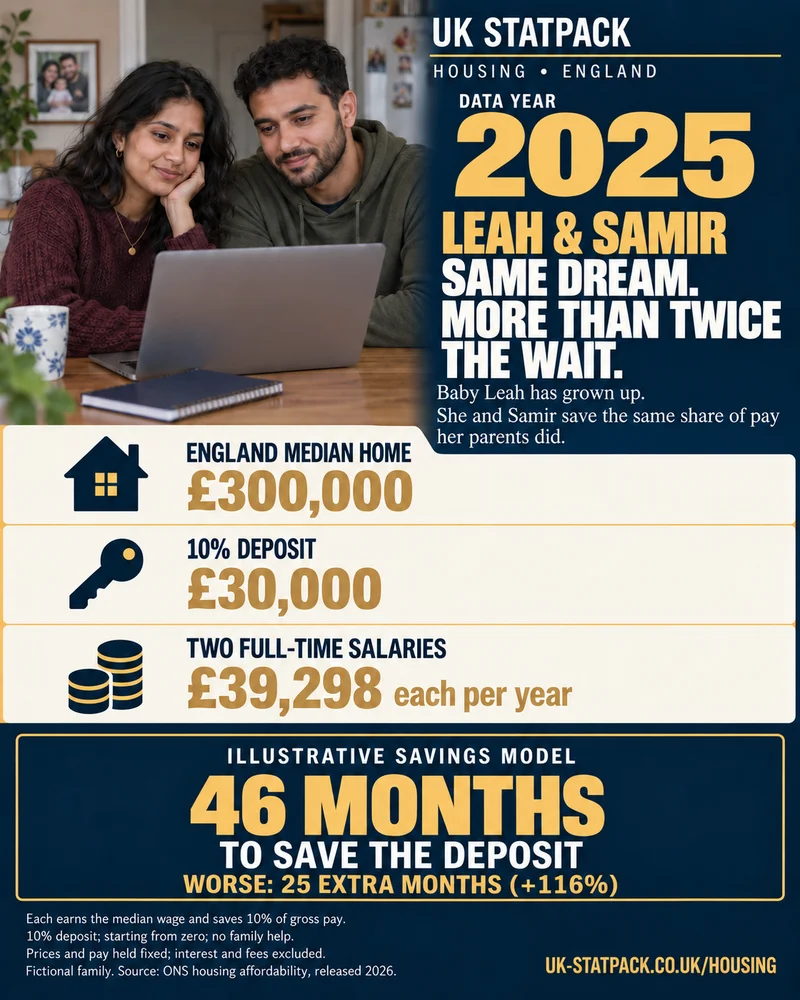
25 extra months to save the deposit (+116%)
Model: two median full-time salaries, saving 10% of gross pay towards a 10% deposit.
- Median home: £60,000 in 1997; £300,000 in 2025.
- Start from zero, with no family help; hold prices and pay fixed while saving.
Median homes and median wages are used here. The adjacent lower-quartile comparison uses cheaper homes and lower earnings.
Sources and calculations: Leah’s family, 1997 vs 2025
England median house prices and median full-time pay, in the years ending September 1997 and 2025 (ONS, published 2026), in a stated savings model. A median is the middle value: half of homes sold for more, half for less.
| Step | 1997 | 2025 |
|---|---|---|
| Median home price (year ending September) | £59,995 (shown as £60,000) | £300,000 |
| Median annual gross full-time pay, per earner | £16,958 | £39,298 |
| 10% deposit | £5,999.50 (shown as £6,000) | £30,000 |
| Household saving a month (2 × pay × 10% ÷ 12) | £282.63 | £654.97 |
| Months to save the deposit | 21.2271494 (shown as 21) | 45.8038577 (shown as 46) |
| For reference: ONS published price-to-earnings ratio | 3.54 | 7.63 |
How it is calculated
- Months = (home price × 10%) ÷ (2 × annual median pay × 10% ÷ 12).
- 1997: £5,999.50 ÷ £282.63 = 21.2271494 months. 2025: £30,000 ÷ £654.97 = 45.8038577 months.
- Difference = 24.5767083 months; increase = 115.7795980%.
- Shown as 21, 46, 25 and +116%. The difference and percentage come from the unrounded values, not from 46 ÷ 21.
Definitions, geography and dates
- Geography: England. Prices are ONS median price paid for all dwellings; pay is ONS median annual workplace-based gross earnings of full-time employees. Both are for the year ending September of the observation year (1997, 2025); the source was published in 2026.
- Both partners earn that year’s full-time median and each saves 10% of gross pay. This is a chosen hypothetical household, not observed median household income or first-time buyers’ incomes, and 10% is a model assumption, not an ONS saving-rate statistic.
- Start from zero: no existing savings, family gift, inheritance, Help to Buy, Lifetime ISA bonus or other help. Prices and pay are held fixed at each year’s level for the whole saving period; no interest, investment return, purchase fees or tax.
- This compares median homes with median wages. The lower-quartile ratio in the chart above answers a different question (cheaper homes against lower earnings). The £300,000 median is not the typical first-time buyer’s purchase price.
What this does not show
- Rent and other bills are not modelled: the ability to save 10% of gross pay is assumed, not shown to be possible after tax, rent and bills. Real households may save more, less or nothing.
- Time to the deposit is not time to buying a home, mortgage approval or an ONS-measured average saving time. These are static illustrative scenarios, not forecasts.
- ONS median sale prices are not mix-adjusted; they are not the price rise of the home pictured. The family timeline is fictional: the 2025 image shows Leah as an adult, not her mother at the same age.
- England median prices and annual pay are a different benchmark from John’s UK average house price and GB weekly pay on the pay page. The two stories must not be combined into one series.
Sources
- ONS, Housing affordability in England and Wales: 2025 — released 2026
- ONS, Ratio of house price to workplace-based earnings (lower quartile and median) — Tables 1a, 1b, 1c (England, row 4), released 2026
Cells used: ONS affordability workbook (England, row 4): 1a!C4 and AE4 (median prices, 1997 and 2025); 1b!C4 and AE4 (median annual earnings); 1c!C4 and AE4 (published ratios).
Text of the two pictures
The people are fictional and the portraits are AI-generated. The pictures and these figures are a dated snapshot approved on 4 October 2026; they are updated together, never one without the other.
1997 picture
Large 1997 data-year label. Priya and Daniel with baby Leah outside a brick house. Priya, a South Asian woman, Daniel, an East Asian man, and baby Leah outside a modest home. England 1997 median home £60,000; illustrative 10% deposit £6,000. Two earners on £16,958 each save 10% of gross pay; the model takes about 21 months to reach the deposit.
Text in the picture
- UK Statpack. Housing • England. Data year 1997.
- Priya & Daniel. A home for baby Leah.
- Her parents are saving for their first home. Two wages. A place for Leah to grow up.
- England median home: £60,000.
- 10% deposit: £6,000.
- Two full-time salaries: £16,958 each per year.
- Illustrative savings model: 21 months to save the deposit.
- Each earns the median wage and saves 10% of gross pay. 10% deposit; starting from zero; no family help. Prices and pay held fixed; interest and fees excluded. Fictional family. Source: ONS housing affordability, released 2026.
- UK-STATPACK.CO.UK/HOUSING
2025 picture
Large 2025 data-year label. Baby Leah is now an adult, looking at a laptop with partner Samir in their flat; she is not her mother aged forward. Leah is now grown up and saving for a first home with her Middle Eastern partner Samir. England 2025 median home £300,000; 10% deposit £30,000. Two salaries of £39,298, saving the same 10% of gross pay, take about 46 months: 25 extra months or 116% longer. Fictional family and explicit savings model.
Text in the picture
- UK Statpack. Housing • England. Data year 2025.
- Leah & Samir. Same dream. More than twice the wait.
- Baby Leah has grown up. She and Samir save the same share of pay her parents did.
- England median home: £300,000.
- 10% deposit: £30,000.
- Two full-time salaries: £39,298 each per year.
- Illustrative savings model: 46 months to save the deposit. Worse: 25 extra months (+116%).
- Each earns the median wage and saves 10% of gross pay. 10% deposit; starting from zero; no family help. Prices and pay held fixed; interest and fees excluded. Fictional family. Source: ONS housing affordability, released 2026.
- UK-STATPACK.CO.UK/HOUSING
3. The monthly cost of a mortgage
What has happened to the cost of borrowing?
A 90% mortgage is quoted at 5.37%, against 1.95% in December 2021
Average quoted interest rate on new 2-year fixed-rate mortgages, by loan to value, UK, monthly.
1996–2026 displayed window · observations only. Shading marks years outside the displayed record.
United Kingdom · January 1996 to September 2026 (90% loan to value from May 2008) · Official statistics (Bank of England)
Sources, definitions and data — A 90% mortgage is quoted at 5.37%, against 1.95% in December 2021
- Geography:
- United Kingdom — New mortgage products advertised by lenders
- Measure:
- Per cent a year
- Period:
- January 1996 to September 2026 (90% loan to value from May 2008)
- Status:
- Official statistics (Bank of England)
- Calculation:
- As published by the Bank of England. Months with too few 90% products to publish a rate are left as gaps, not zero.
- Compare with:
- December 2021: 1.95% (90%) and 1.57% (75%)
- Not included / breaks:
- Quoted rates on new loans, not the average rate paid on existing mortgages, and before arrangement fees.
Source: Bank of England, quoted household interest rates (series IUMBV34 and IUMB482), Bankstats table G1.4. Chart HOUSE-06.
View the data as a table
| Month | 75% LTV | 90% LTV |
|---|---|---|
| Dec 1996 | 7.24 | not published |
| Dec 1997 | 7.13 | not published |
| Dec 1998 | 6.42 | not published |
| Dec 1999 | 6.52 | not published |
| Dec 2000 | 6.03 | not published |
| Dec 2001 | 4.98 | not published |
| Dec 2002 | 4.62 | not published |
| Dec 2003 | 5.05 | not published |
| Dec 2004 | 5.07 | not published |
| Dec 2005 | 4.74 | not published |
| Dec 2006 | 5.15 | not published |
| Dec 2007 | 6.06 | not published |
| Dec 2008 | 4.77 | 6.69 |
| Dec 2009 | 4.05 | 6.64 |
| Dec 2010 | 3.50 | 6.15 |
| Dec 2011 | 3.22 | 5.45 |
| Dec 2012 | 3.35 | 5.39 |
| Dec 2013 | 2.40 | 4.36 |
| Dec 2014 | 2.08 | 3.89 |
| Dec 2015 | 1.90 | 2.87 |
| Dec 2016 | 1.45 | 2.53 |
| Dec 2017 | 1.57 | 2.21 |
| Dec 2018 | 1.73 | 2.24 |
| Dec 2019 | 1.42 | 2.07 |
| Dec 2020 | 1.86 | 3.75 |
| Dec 2021 | 1.57 | 1.95 |
| Dec 2022 | 5.43 | 6.00 |
| Dec 2023 | 5.03 | 5.69 |
| Dec 2024 | 4.60 | 5.37 |
| Dec 2025 | 3.97 | 4.42 |
| Sep 2026 | 5.13 | 5.37 |
What the rate change means for a monthly payment
For every £100,000 borrowed on a 25-year repayment mortgage, the monthly payment at the December 2021 rate for a 90% mortgage (1.95%) was about £421. At the latest rate (5.37%) it is about £606 — 44% more. Most buyers fix for two or five years, so the rise reaches existing owners only as their deals end.
UK Facts calculation using the standard repayment formula; illustrative, ignores fees, and rates offered to individual buyers vary.
Who is buying, and who is not
Are younger households still able to buy?
Young home ownership fell to 35.8% and has partly recovered to 47.7%
Share of households with a household reference person aged 25–34 who own their home (outright or with a mortgage), England.
1996–2026 displayed window · observations only. Shading marks years outside the displayed record.
England · 2003–04 to 2024–25 · Official statistics (survey estimate)
Sources, definitions and data — Young home ownership fell to 35.8% and has partly recovered to 47.7%
- Geography:
- England — Households headed by someone aged 25–34
- Measure:
- Per cent of households
- Period:
- 2003–04 to 2024–25
- Status:
- Official statistics (survey estimate)
- Calculation:
- As published (Annex Table 1.4).
- Compare with:
- 2003–04: 58.6%
- Not included / breaks:
- Counts households, not people: young adults living with parents or sharing are not counted as separate households, so the rate can rise while fewer young people have a home of their own. The 2020–21 survey was run by phone during the pandemic and is less comparable.
Source: MHCLG, English Housing Survey headline report 2024–25, Annex Tables 1.1 and 1.4. Chart HOUSE-07.
View the data as a table
| Year | Owners (%) |
|---|---|
| 2003–04 | 58.6 |
| 2004–05 | 56.7 |
| 2005–06 | 56.0 |
| 2006–07 | 56.5 |
| 2007–08 | 55.2 |
| 2008–09 | 51.5 |
| 2009–10 | 46.6 |
| 2010–11 | 43.1 |
| 2011–12 | 42.8 |
| 2012–13 | 39.5 |
| 2013–14 | 35.8 |
| 2014–15 | 36.7 |
| 2015–16 | 38.2 |
| 2016–17 | 37.3 |
| 2017–18 | 37.6 |
| 2018–19 | 41.2 |
| 2019–20 | 40.9 |
| 2020–21 | 46.9 |
| 2021–22 | 41.4 |
| 2022–23 | 44.7 |
| 2023–24 | 45.4 |
| 2024–25 | 47.7 |
Competing explanations
Supply. England has built fewer homes than households have formed in many years, especially where jobs are growing, so prices rose faster than pay. This is the mainstream view and the basis of the government’s 1.5 million homes aim.
Interest rates and credit. Falling interest rates from the 1990s to 2021 let buyers borrow more for the same monthly payment, which pushed prices up everywhere — including in places with plenty of housing. A Bank of England staff working paper (Miles and Monro, 2019) found that the fall in real interest rates could more than account for the rise in prices relative to incomes between 1985 and 2018; staff papers are research, not the Bank’s view. Higher rates since 2022 are the main reason prices stalled.
Demand from investors and existing owners. Buy-to-let and second-home buying compete with first-time buyers for the same homes; tax changes since 2016 have reduced this.
These explanations are not exclusive. The practical consequence is that building more homes is necessary but would lower prices relative to pay only slowly, and that a fall in interest rates would help buyers’ monthly costs while pushing prices back up.
What would change it
More homes in high-demand areas, more homes for social rent, and the construction workforce to build them are compared — with owners, costs, evidence and trade-offs — in What would move the needle?, and in more depth in the housing remedies comparison.
Sources and methods (4)
- ONS, Housing affordability in England and Wales: 2025, dataset Tables 1c and 2c (released 26 March 2026) — median and lower-quartile price to earnings ratios
- Bank of England, quoted household interest rates (series IUMBV34 and IUMB482), Bankstats table G1.4 — quoted 2-year fixed mortgage rates
- MHCLG, English Housing Survey headline report 2024–25, Annex Tables 1.1 and 1.4 — home ownership among 25–34 year olds
- Bank of England Staff Working Paper No. 837, UK house prices and three decades of decline in the risk-free real interest rate (Miles and Monro, December 2019) — interest rates as a driver of prices
Method notes
- Affordability ratios: England, workplace-based earnings of full-time employees.
- Mortgage rates: UK quoted rates on new 2-year fixed-rate loans; not rates paid on existing mortgages.
- Home ownership: English Housing Survey, households by age of the household reference person.